好友
阅读权限20
听众
最后登录1970-1-1
|
 矢岛舞美
发表于 2024-11-14 12:41
本帖最后由 矢岛舞美 于 2024-11-14 13:20 编辑

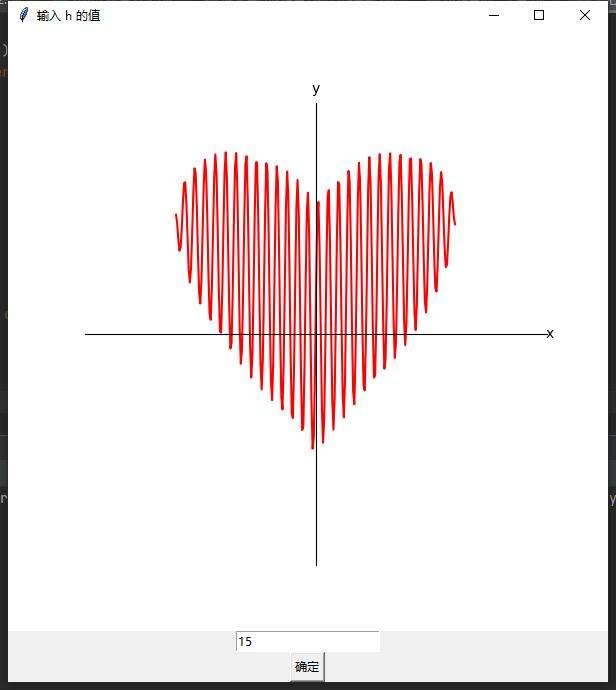
[Python] 纯文本查看 复制代码 import numpy as np
import matplotlib.pyplot as plt
from matplotlib.backends.backend_tkagg import FigureCanvasTkAgg
import tkinter as tk
# 定义绘图函数
def plot_function(h):
x = np.linspace(-3, 3, 400)
with np.errstate(invalid='ignore'):
# 使用绝对值确保对称性
y = np.empty_like(x)
for i, xi in enumerate(x):
if 3.3 - xi ** 2 >= 0:
y[i] = np.abs(xi) ** (2 / 3) + 0.9 * np.sqrt(3.3 - xi ** 2) * np.sin(h * np.pi * xi)
else:
y[i] = np.nan
ax.clear()
ax.plot(x, y, color='red')
# 设置四个象限的坐标轴
ax.spines['left'].set_position('center')
ax.spines['bottom'].set_position('center')
ax.spines['right'].set_color('none')
ax.spines['top'].set_color('none')
# 设置相同的单位长度
ax.set_aspect('equal', 'box')
# 设置坐标轴范围和刻度
ax.set_xlim(-3, 3)
ax.set_ylim(-3, 3)
ax.set_xticks([])
ax.set_yticks([])
# 在坐标轴末端添加 x 和 y 标签
ax.annotate('x', xy=(3, 0), xytext=(5, 0),
textcoords='offset points', ha='right', va='center')
ax.annotate('y', xy=(0, 3), xytext=(0, 5),
textcoords='offset points', ha='center', va='bottom')
ax.grid(True, linestyle='--', color='gray', alpha=0.7)
canvas.draw()
# 更新图形
def update_plot():
try:
h_value = float(entry.get())
plot_function(h_value)
except ValueError:
print("请输入一个有效的数字")
# 创建 Tkinter 窗口
root = tk.Tk()
root.title("输入 h 的值")
# 创建 Matplotlib 图形
fig, ax = plt.subplots(figsize=(6, 6))
canvas = FigureCanvasTkAgg(fig, master=root)
canvas.get_tk_widget().pack()
# 初始绘图
plot_function(1.0)
# 创建输入框和按钮
entry = tk.Entry(root)
entry.pack()
entry.insert(0, "1.0")
button = tk.Button(root, text="确定", command=update_plot)
button.pack()
# 运行 Tkinter 主循环
root.mainloop()
修改版本,增加动态绘制过程
[Python] 纯文本查看 复制代码 import numpy as np
import matplotlib.pyplot as plt
from matplotlib.backends.backend_tkagg import FigureCanvasTkAgg
from matplotlib.animation import FuncAnimation
import tkinter as tk
# 定义绘图函数
def plot_function(h):
x = np.linspace(-3, 3, 400)
with np.errstate(invalid='ignore'):
y = np.empty_like(x)
for i, xi in enumerate(x):
if 3.3 - xi ** 2 >= 0:
y[i] = np.abs(xi) ** (2 / 3) + 0.9 * np.sqrt(3.3 - xi ** 2) * np.sin(h * np.pi * xi)
else:
y[i] = np.nan
return x, y
# 更新函数
def update(frame):
h_value = float(entry.get())
x, y = plot_function(h_value * frame / 100)
ax.clear()
ax.plot(x, y, color='red')
ax.spines['left'].set_position('center')
ax.spines['bottom'].set_position('center')
ax.spines['right'].set_color('none')
ax.spines['top'].set_color('none')
ax.set_aspect('equal', 'box')
ax.set_xlim(-3, 3)
ax.set_ylim(-3, 3)
ax.set_xticks([])
ax.set_yticks([])
ax.annotate('x', xy=(3, 0), xytext=(5, 0),
textcoords='offset points', ha='right', va='center')
ax.annotate('y', xy=(0, 3), xytext=(0, 5),
textcoords='offset points', ha='center', va='bottom')
ax.grid(True, linestyle='--', color='gray', alpha=0.7)
# 更新公式显示
formula = (r"$y = x^{\frac{2}{3}} + 0.9 \cdot (3.3 - x^2)^{\frac{1}{2}} \cdot "
r"\sin(h \pi x)$")
ax.text(0.5, 1.05, formula, transform=ax.transAxes, fontsize=12, ha='center', va='bottom')
canvas.draw()
# 创建 Tkinter 窗口
root = tk.Tk()
root.title("输入 h 的值")
# 创建 Matplotlib 图形
fig, ax = plt.subplots(figsize=(6, 6))
canvas = FigureCanvasTkAgg(fig, master=root)
canvas.get_tk_widget().pack()
# 创建输入框和按钮
entry = tk.Entry(root)
entry.pack()
entry.insert(0, "1.0")
# 创建动画
ani = FuncAnimation(fig, update, frames=100, interval=50, repeat=True)
# 运行 Tkinter 主循环
root.mainloop()
|
免费评分
-
查看全部评分
|
 发表于 2024-11-14 12:41
 发表于 2024-11-14 13:05